Docker Observability Stack
A downloadable toolkit
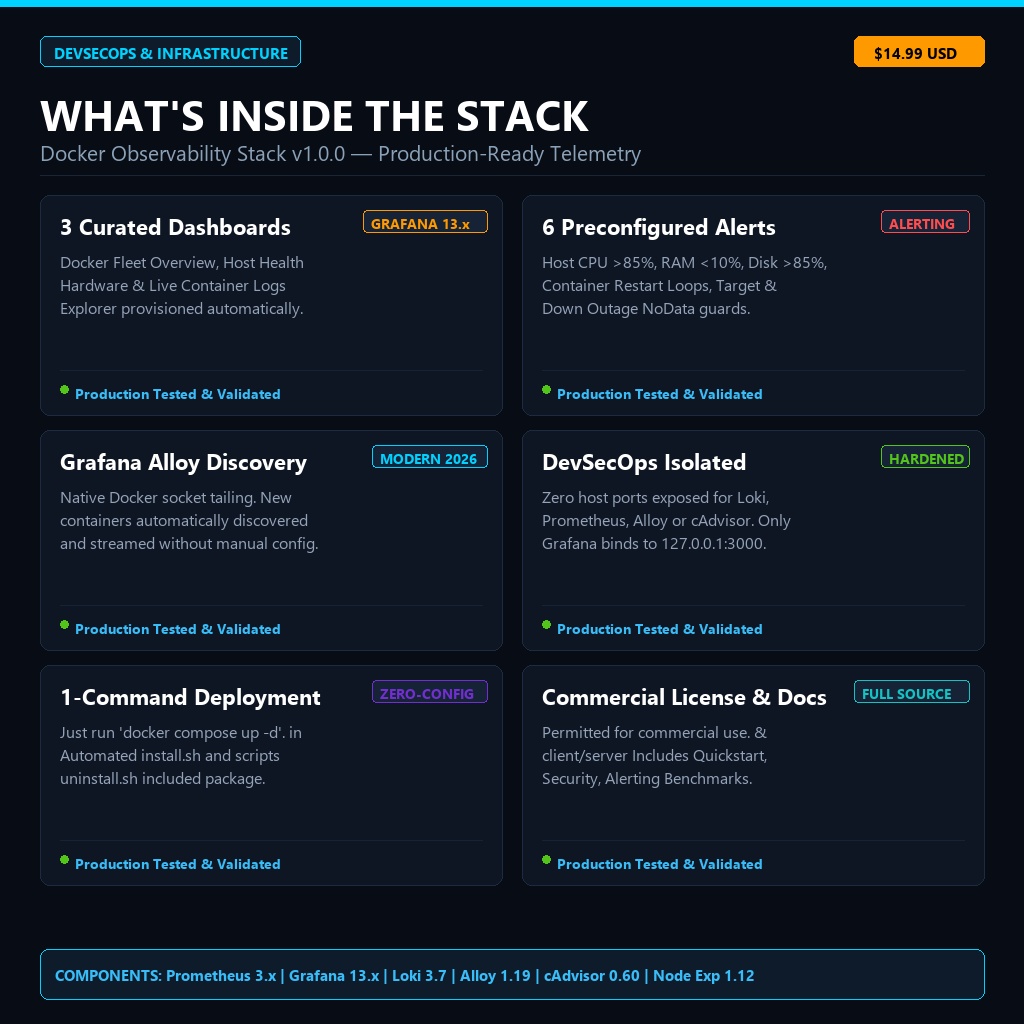
# Docker monitoring without the setup headache **NitaLabs Docker Observability Stack** is a ready-to-deploy monitoring stack for Linux Docker hosts. Instead of spending hours wiring Prometheus, Grafana, Loki, cAdvisor, Node Exporter and log collection together, you get a complete baseline that is already configured, connected and ready to use. ```bash cp .env.example .env docker compose up -d
Open Grafana and start monitoring your containers and host.
No manual datasource setup.
No dashboard imports.
No latest image tags.
No exposing your monitoring services directly to the Internet.
What you get
📊 Docker monitoring
See the health and resource usage of your running containers:
- CPU usage
- Memory consumption
- Memory limits
- Network RX / TX
- Block I/O
- Container uptime
- Restart activity
🖥️ Linux host monitoring
Track the infrastructure underneath your containers:
- Host CPU
- Available RAM
- Swap usage
- Root filesystem usage
- Load average
- Network throughput
- Resource trends over time
📜 Centralized Docker logs
Stop opening terminals just to run docker logs on individual containers.
Docker logs are automatically collected through Grafana Alloy and stored in Loki, giving you:
- Container-based filtering
- Text search
- Regex search
- Log stream exploration
- Log volume visualization
All directly inside Grafana.
🚨 Alerts included
The stack comes with preconfigured Grafana alert rules for common infrastructure problems:
- High host CPU
- Low available memory
- Root filesystem almost full
- High container memory usage
- Container restart activity
- Observability targets becoming unavailable
You can connect Grafana notifications to Discord, Slack, Telegram or generic webhooks.
🔒 Secure by default
Internal observability services are not exposed on host ports.
Prometheus, Loki, Alloy, cAdvisor and Node Exporter communicate through the internal Docker network.
Only Grafana is published by default:
127.0.0.1:3000
For remote VPS or cloud servers, you can access it securely through an SSH tunnel.
The included security guide also explains the implications of Docker socket access and recommended deployment practices.
⚡ Everything is preconfigured
The package includes:
- Docker Compose orchestration
- Prometheus configuration
- Loki log storage
- Grafana Alloy Docker log discovery
- cAdvisor container metrics
- Node Exporter host metrics
- Grafana datasources
- 3 ready-to-use dashboards
- 6 alert rules
- Persistent volumes
- Health checks
- Installation scripts
- Security documentation
- Troubleshooting documentation
- Resource usage benchmarks
- Real dashboard screenshots
Included dashboards
Docker Overview
A single view of your active container infrastructure.
Host Overview
CPU, RAM, disk, load and network metrics from the Linux host.
Logs Explorer
Search and inspect centralized Docker logs without jumping between containers.
Built for reproducible deployments
All components use explicit pinned versions rather than floating latest tags.
Included stack:
- Grafana
- Prometheus
- Loki
- Grafana Alloy
- cAdvisor
- Node Exporter
This makes the environment easier to reproduce and prevents unexpected upgrades when redeploying.
Resource footprint
In our test environment, the complete six-service stack used approximately:
~440 MiB RAM during stable operation
and approximately:
~462–556 MiB during active discovery and log workloads
Actual resource consumption depends on your host, number of containers, log volume, retention settings and workload.
Detailed measurements are included in docs/RESOURCE_USAGE.md.
Who is this for?
Built for:
- DevOps Engineers
- Linux SysAdmins
- SREs
- DevSecOps Engineers
- Cloud Engineers
- VPS administrators
- Freelance infrastructure engineers
- Homelab users
- Developers managing Docker servers
- Students learning observability
Save the setup time
You can absolutely build this stack yourself.
The value of this package is that you don't have to start from zero.
The services are already wired together, dashboards and datasources are provisioned automatically, logging is connected, alerts are included, security defaults are documented, and the complete stack has been tested as a working system.
Deploy it, customize it and use it for your own infrastructure or client environments.
📦 Included files
docker-compose.yml.env.exampleinstall.shuninstall.sh- Grafana dashboards & provisioning
- Prometheus configuration
- Loki configuration
- Grafana Alloy configuration
- Full documentation
- Real dashboard screenshots
- Commercial-use license
📄 License
Commercial use is permitted for your own infrastructure and client environments according to the included license.
You may customize the stack for your own projects and customer deployments.
Redistribution, resale, sublicensing or repackaging the toolkit itself as a competing downloadable product is not permitted.
NitaLabs Docker Observability Stack v1.0.0
One ZIP. One Compose stack. Metrics, logs, dashboards and alerts ready to go.
Purchase
In order to download this toolkit you must purchase it at or above the minimum price of $14.99 USD. You will get access to the following files: